Social Impact Report Sections:
Program Introduction
The first page of a Social Impact Report includes the program’s name, the organization’s name, and the program’s mission or goals. It also includes the time period that this report captures and whether the report is forecasting the included impacts (Initial or Interim) or if the report captures achieved impacts (Final). Lastly, this section outlines where the program takes place and how long a typical program period lasts.
Funder Claim
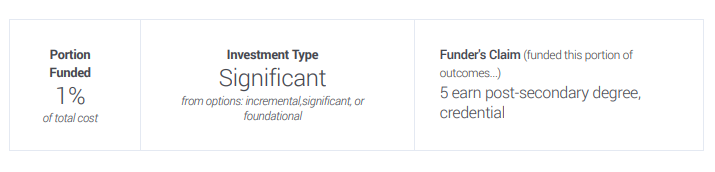
Following the introduction of the program, the Social Impact Report includes some information in a small box called the “Funder’s Claim.” This section tells funders how many impacts they can “claim” because of their funding. The funder’s impact claim is proportional to their support of a program unless the funder’s investment type is “Foundational” in which case the funder can claim 100% of a program’s impact. The nonprofit determines what Investment Type is appropriate for their funder. You can read more about the calculation of a funder’s claim here.
Core Services
The “Core Services” section of the Social Impact Report captures key details about how a program works including what kinds of activities a program runs and how often the program connects with their beneficiaries. This section sheds light on the nature of the program’s intervention - is it a light touch or a deeper engagement?
Beneficiaries
This section details whose lives are improved as a result of the program. It includes a summary about those individuals as well as a breakdown of their demographics. The nonprofit determines which demographic categories to include and reports out on the percentages based on direct measurements or estimates from secondary data. True Impact encourages nonprofits to include socioeconomic status, race/ethnicity, gender, and age categories in their beneficiary section. Beneficiary demographic categories are not mutually exclusive so overlap is likely. You can learn more about how nonprofits complete the beneficiaries section here.
Impact Model/Theory of Change
The Impact Model/Theory of Change section is the heart of the Social Impact Report. This section captures the story of a program’s impact and how the program creates value.
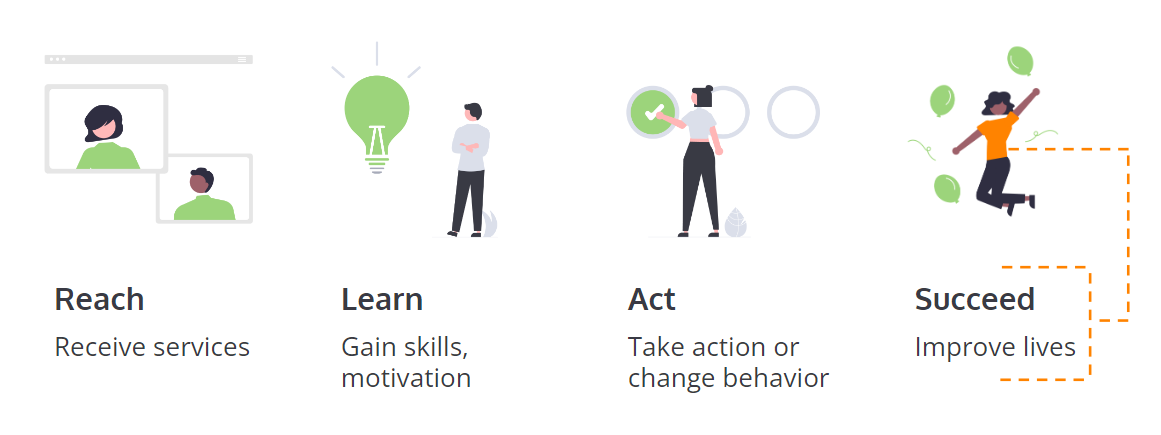
Every Impact Model/Theory of Change is different because every program’s story is different. The standard Impact Model/Theory of Change framework captures a few key stages: how a program engages people (Reach) who go on to gain skills or motivation (Learn) and then do something with that learning (Act). The Impact Model/Theory of Change ends with the Succeed or Social Impact stage: the stage in which the program improves lives or makes contributions to society. A program’s Impact Model/Theory of Change captures a program’s unique story and may or may not include all the stages (only Reach and Succeed are required).
After a nonprofit identifies which Impact Model/Theory of Change stages are relevant to their model, they then identify the specific indicators that are relevant within each stage. They also detail how each indicator is defined, counted, and tracked.
Indicator Definition:
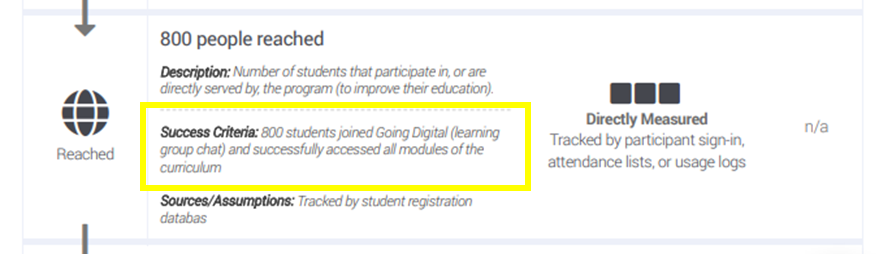
To learn how a nonprofit defines success for a specific indicator, review the language following “Success Criteria.” In this example, a nonprofit defines success with in the Reach stage of the Impact Model as students who successfully join the Going Digital learning group chat and access all of the curriculum modules.
Indicator Quantity:
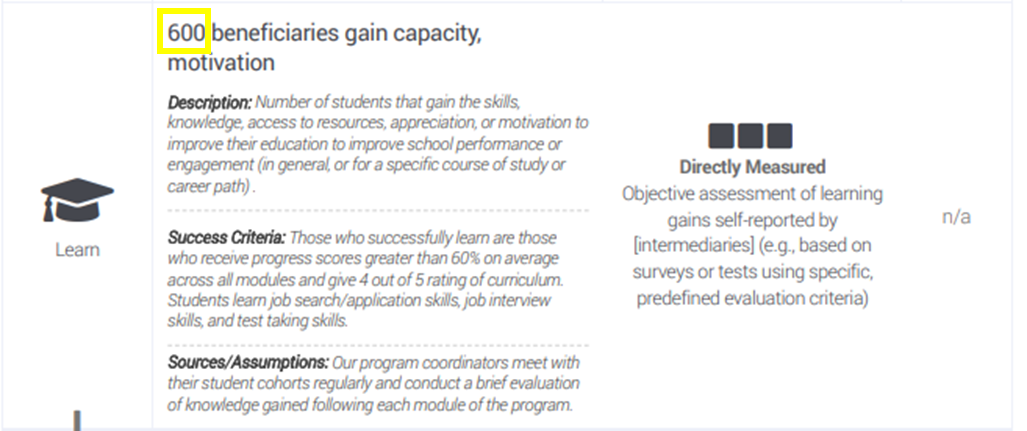
To learn how a nonprofit quantifies a particular indicator, review the figure that precedes the indicator name. In this example, a nonprofit notes that 600 people successfully learn.
Indicator Tracking
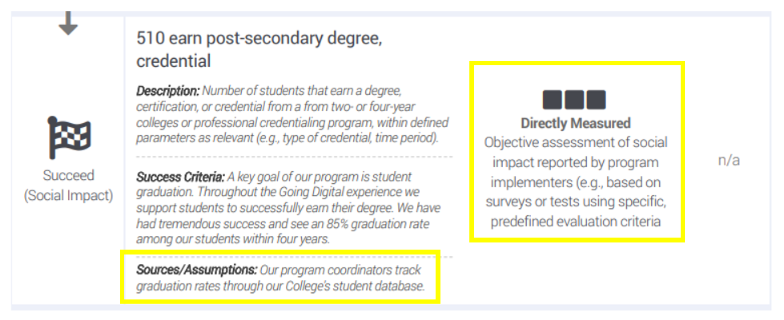
To learn how a nonprofit tracks or measures their specific indicators, review the measurement type and the Sources/Assumptions. Both detail the way in which the nonprofit gathers data about that specific indicator. True Impact defines quality data as Direct Measurements or Estimates. You can learn more about how True Impact defines quality data here.
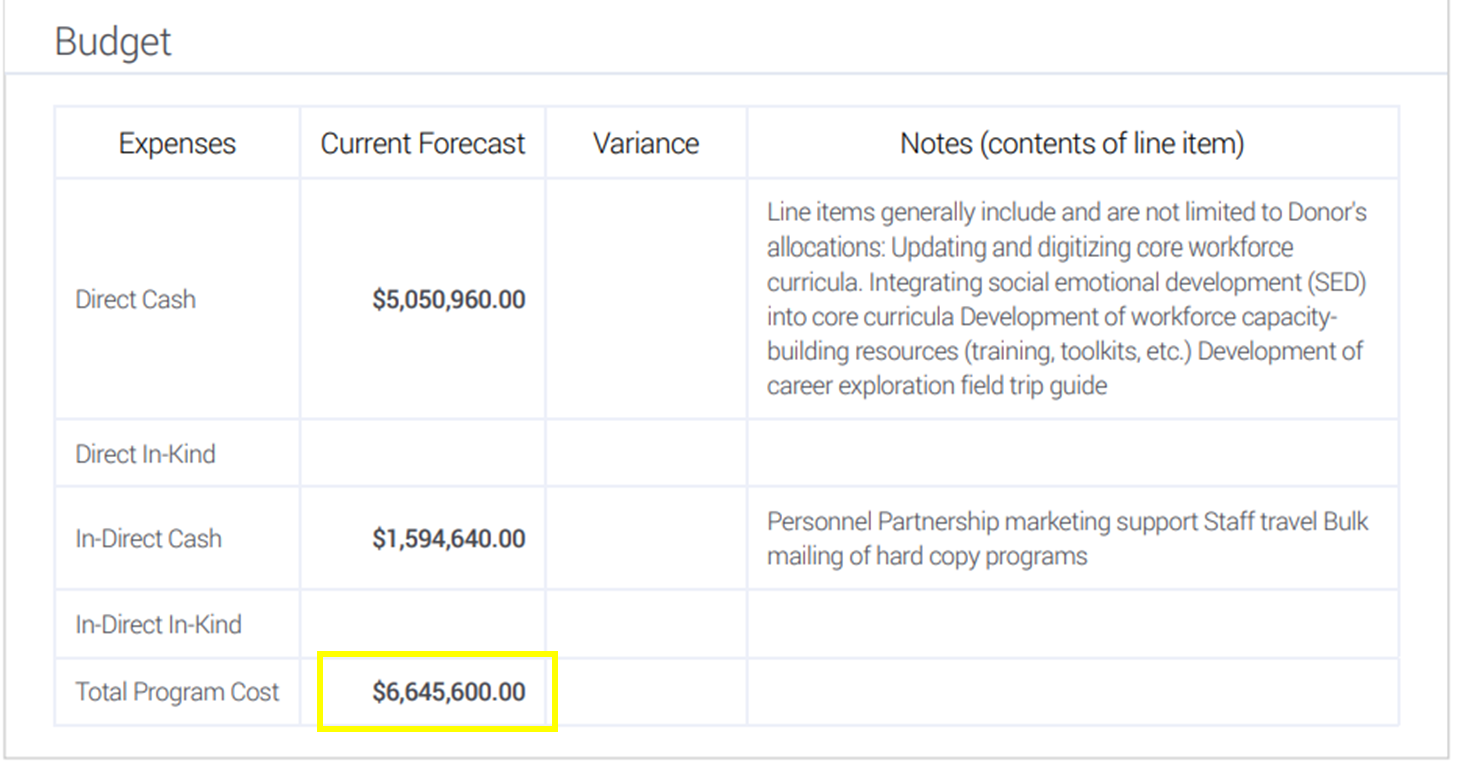
Budget