True Impact Dashboards Guide
Technical items:
- You can log in to these dashboards, via this link.
- Data is best shown using Microsoft Edge as browser.
- When entering the credentials, don’t copy and paste (write them out)
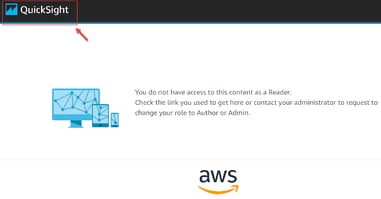
- If you are logging in for the very first time, you will see a pop-up that says you do not have access to this content (this is because only True Impact has access to edit these dashboards)- to bypass, click on the QuickSight logo in the left corner (see screenshot). Once you complete this one time, you shouldn't have to complete this step again. (see screenshot)
 When you access the homepage, click on the ‘Impacts’ dashboard. The ‘Compliance’ dashboards are for tracking which partners have completed their impact reports.
High-Level Do’s and Don’ts
- Consider whether you’d like to use projected data when communicating impact results.
- Sort by report stage to isolate final results (only selecting Final) or omit forecasts (selecting Final and Interim)
- Pay close attention to the “unit” of impact. Some impacts are people, and some units are non-people such as acres of land improved, or funds raised.
- All impacts are the funder’s “claim” of programs’ impacts. These are the successes you can claim came about due to your company’s funding.
- If you'd like to download any of the tables, you can do so by clicking on the table and then the three horizontal dots at the bottom of the small dialogue box that pops up. You can export to CSV or Excel.
Controls: At the top of the dashboard, you can control by Portfolio, Investment Year, or Report Stage
- Report Stages-
- Initial- reports of programs that are in the initial phase,
- Interim- Reports of programs that are mid-implementation
- Final- Reports of final data and outcomes achieved by investment
- **Keep these in mind when using data out of dashboards in any internal/external communication
- Portfolio
- Isolate reports from a giving focus area (i.e. health, education, etc.)
- Note: If you control for certain criteria in summary page, all the tabs will reflect the data in those filters.
Donations and Impact Tab
This is a high-level story of impact data
- Donated- amount of funding reflected in impact data. This figure represents the total investment amount that is currently measured via True Impact.
- Funded programs- # of programs represent the # of reports. Note: This is the number of programs not the number of organizations. Some organizations report out on multiple programs.
- People Reached- # of people engaged by our funding. Engagement can mean participation in programming, attendance at an event, enrollment, etc.
- People Succeed/ Social Impacts- Lives improved or contributions to society (not all successes are people). Note: People can experience multiple successes (i.e. students improve behavior, students and students succeed in school)
- Note: For people reached and social impacts- these figures represent our claim, not total # of people reached or impacted by those programs we’ve invested in.
Donations by Location Tab
- The map includes the locations of program service delivery and magnitude of the investment to that program.
- Location is grantee-defined and can be very specific or general.
- Shows the reach of programs ran through True Impact in a map.
- Map is being pulled by the Location of Impact Receipt
- (Please note that the geographic data is only as good as the data our partners enter)
Beneficiaries Tab
- Grantees select beneficiary categories from a standardized demographic list from Candid.
- Grantees determine which demographic categories they will report out on.
- Beneficiaries can fall into multiple categories.
- Beneficiaries reached by programs run through True Impact
- Demographics show beneficiaries – not mutually exclusive
- Note: Beneficiaries belong to more than one demographic category (overlap)
Investment Approach Tab
This tab breaks down for your catalyzed impacts. Your nonprofit partners have the opportunity to identify your investment as one of the following:
- Incremental: a non-primary contribution to the program's overall funding;
- Significant: one of the largest contributions to the program's overall funding; or
- Foundational: catalyzed other investors, or was significant enough that its absence might have undermined the viability of the program
Catalyzed impacts: Catalytic impacts are social-impact ripple effects that you can claim beyond those you directly funded. That is, if you are a “foundational” donor to a program–i.e., where the program might not have been implemented without your support–you can make a funded (or “contribution”) claim on its social impacts in proportion to how much of you funded (e.g., 50% funding = 50% claim on social impact), and a catalyzed claim on the rest, since you enabled the whole program to be implemented. Further catalytic claims can be made if your foundational donation results in a new program, model, or resource that is then replicated in the future (i.e., the social impacts of those replications for a certain period, typically three to five years, even if you are not funding those replications).
Social Return on Investment Tab
Social return on investment (i.e., social ROI or SROI) is the amount of social value you generate because of your donation to a philanthropic program. This tab depicts the number of successful outcomes per $10,000 invested. In working with your Social Impact Manager, you can view your SROI by different types of impacts
Data Quality Tab
This tab depicts the quality of the data of your nonprofit partners' social impact reports. The tab includes:
- % Of social impacts based on high quality data
- Three types of data/reporting
- Guess- low quality data
- Guess based on experience, anecdotal results, or logical assumptions.
- Estimate- estimate based on evidence- high quality
- Estimate based on data from other, similar programs; indirect tracking of outcomes (e.g., government data); or the program's past results.
- Measured- directly measured- high quality data
- Direct measurement of program results, including testing, monitoring, or reporting by the beneficiaries or program implementers, using subjective or objective evaluation criteria.
- Guess- low quality data
Compliance + Stage +Tier Tab
This tab depicts the reporting status of your partners using this taxonomy:
- Complete- reports are published
- Awaiting TI verification- TI must verify changes before it gets published as complete
- TI feedback provided- TI had provided feedback and grantees must go in and submit changes/updates.
- Awaiting TI Feedback- first draft of report has been submitted by grantee, and TI needs to provide feedback
- Waiting- Reports are in draft form or haven’t been started by grantee
Sustainable Development Goals Tab
In this tab, you'll find how your social impacts map onto the United Nations Sustainable Development Goals. The indicator table aligns reported partner successes to the United Nations Sustainable Development Goals across the years of your community investments. The Sustainable Development Goals are a call for action to promote prosperity while protecting the planet. For more information, visit the UN Sustainable Development Goals.
Sample Impact Receipt Tab
This excerpt from a full social impact report (accessible via your True Impact account) summarizes a program you are supporting with your philanthropy, including:
- Stage: Defines each step of the funded program’s “theory of change” (i.e., how it creates value).
- Grantee Definition: How the NPO defines success for the indicator they’re reporting on (i.e., qualifies a result to be counted as an impact)
- Data Quality: How the reported data are/will be sourced. Directly measured and estimated based on objective data are both considered high-quality data (i.e., evidence-based); guesses are not.
- Program Impact: The impacts reported by grantee they expect to achieve or have achieved.
- Funder Claim: How much of the NPO’s actual or expected impacts – depending on whether they’ve completed a final or interim report – you can claim, based on the portion of the program you funded.
Full Outcomes Tab
This tab includes a full exportable table of all your partners' social impact reports' full logic models, program definition of success, investment amount, total cost, claimed/catalyzed impacts, and SROI. It provides a handy reference if you'd like to download your complete report data from one source.